


2020 Region P Population Estimate: 2,945,792

August 10, 2021 Update | The county case count numbers below are logged from the Texas Department of State Health Services. For the days of August 7, 8 and 9, there were no additions to the total cases. The only changes were moves from the active to recovered category. These moves happen automatically based on time, and are not based on actual testing.
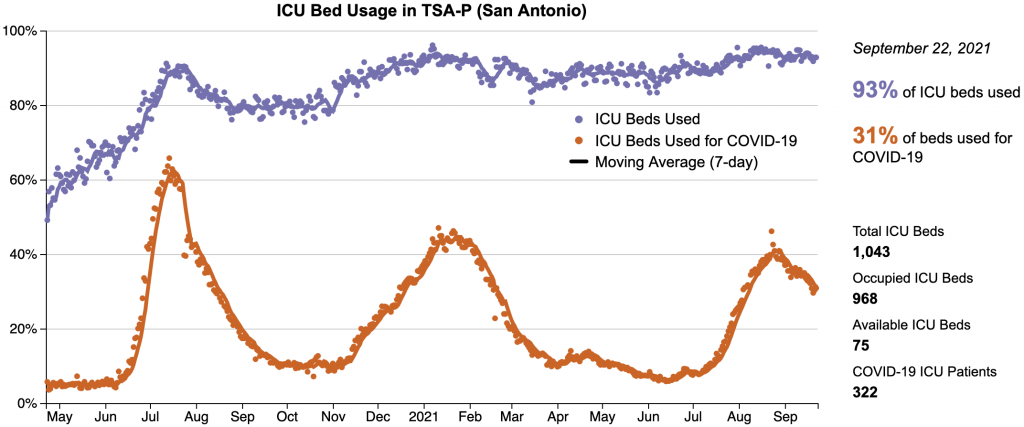
In short, it appears that the state of Texas has stopped reporting new cases not only in Frio, but in each of the counties we sample. Medina, Atascosa, La Salle, Dimmit, and Zavala did not log any new cases for August 7, 8, and 9 according to DSHS, except for one fatality in Medina. In those same three days, hospital usage rose by 2% in Region P.
August 8, 2021 Update | Added “ICU Bed Usage in Region P (San Antonio)” Graph from https://covid-texas.csullender.com/?tsa=P
August 6, 2021 Update | Added “Frio County 1st Dose & Fully Vaccinated 12+ (%)” Graph
July 21, 2021 Update | Delay in Reporting Fatalities by State of Texas
“A fatality is counted as due to COVID-19 when the medical certifier, usually a doctor with direct knowledge of the patient, determines COVID-19 directly caused the death. This method does not include deaths of people who had COVID-19 but died of an unrelated cause. Death certificates are required by law to be filed within 10 days.“
– Texas Department of State Health Services Website
July 21, 2021 Update | Added “COVID Hospitalizations out of Total Hospital Capacity (Percent) by Trauma Service Area P Over the Previous 7 Days” Graph
July 17, 2021 Update
Added La Quinta Pearsall Detainees to the dashboard.
July 14, 2021 Update
This dashboard is a replication of the former Frio COVID Lifeline website. Because the State of Texas no longer provides the same data, there are some key differences:
In the former website, the “Frio County Case Count” box counted residents only, and did not include ICE or TDCJ inmates. However, the Texas Department of State Health Services no longer separates those values, so the Active (Estimated), Recovered (Estimated), and Fatalities boxes will include ICE and TDCJ cases until further notice.
But you might notice that today (July 14, 2021), the number of active ICE cases (89), exceeds the reported total number of Active cases in the county (32). This means that the Texas Department of State Health Services has delayed incorporating the ICE (and likely TDCJ) active numbers into their dashboard.
Since these numbers were last tracked five months ago, CoreCivic’s South Texas Family Residential Center in Dilley leapfrogged GEO’s South Texas ICE Processing Center in Pearsall in total Covid cases. On February 17, 2021, Dilley CoreCivic total cases were 44, while Pearsall GEO total cases were 312. Today, those numbers stand at 937 in Dilley and 805 in Pearsall.
Given that ICE cases have yet to show up in our active totals as reported by the DSHS, it becomes apparent that our total cases are severely underreported as well. Expect a reporting spike when DSHS catches up with the data.
TDCJ no longer reports Offender Recovered or Employee Recovered numbers. Frio COVID Lifeline used to track increases in the sum of active and recovered numbers to arrive at a number of new cases. Without the recovered number, we can no longer track new cases.
Unfortunately, these are the best numbers we have. I am sharing them because, in this case, I believe some information is better than none.
–written by Jose Asuncion, County Commissioner, Pct. 4